With Annual Reviews consuming most of my waking hours, I thought this would be the perfect time to blog about testing.
Speaking from a therapist's point of view and a parent's point of view, reports that include testing results can be overwhelming and confusing. It is always a challenge to describe the child in the most technically accurate way (to be respected by colleagues), while still making it "parent-friendly."
For the parents reading this, the easiest way to gain understanding about how your child is doing is to speak directly with the therapist, allowing for explanation and questions.
What is a Standard Score?
The technical answer: A standard score is a way to compare a student's performance to that of the standardization sample of the assessment. It is calculated based on the raw score, which is then transformed to a common scale. It is based on a bell curve (normal distribution), which contains a mean and a standard deviation.
What does this really mean? This is a comparison score. In other words, this score considers how children perform compared to those children that were used in the creation of the test (a.k.a. a normative sample).
What is a Percentile Rank?
The technical answer: A measure that tells us what percent of the total frequency scored at or below that measure.
What does this really mean? Let's use marbles as an example, since they are all beautiful and unique no matter where they fall. If we took 100 marbles that had the color blue in them and lined them up (least amount of blue in the "1st" spot and most amount of blue in the "100th" spot) then you could conclude that the marble in the "50th" spot (or percentile) had "as much" or "as little" blue in it as 50% of the other marbles. The marble in the "25th" spot (or percentile) had more blue than 25% or one-quarter of the other marbles but not as much as 75% or three-quarters of the other marbles.
What is a Standard Deviation?
The technical answer: A measure of dispersion of data from the mean.
What does this really mean? Well, before we can know the standard deviation, we need to know what we are "deviating" from. In this case, it is the "mean" or "statistical average." I find the best way to explain standard deviation is with a visual.
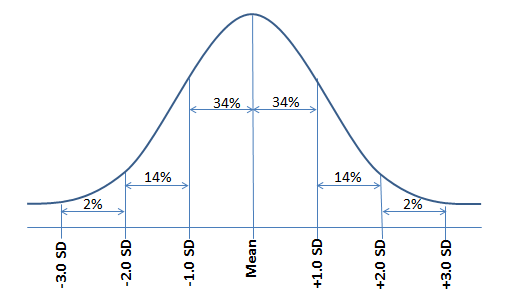
When looking at this bell curve, the percentages indicated (34%, 14%, 2%) represent the percentage of the population included within this area. In other words 68% (34% + 34%) of the population scores within one standard deviation of the mean (between -1.0 and +1.0 standard deviations). Furthermore, 96% (14% + 34% + 34% + 14%) of the population score within two standard deviations from the mean (between -2.0 and +2.0 standard deviations). The remaining 4% of the population score more than two standard deviations from the mean.
What is a Confidence Interval?
The technical answer: An interval estimate of a population used to indicate reliability.
What does this really mean? Many therapists do not typically include a confidence interval when reporting scores. This does not make one therapist's testing better than another's. It is yet another way to interpret the data. In a nutshell, it is a range of numbers, which includes the standard score. For example, let's say that a child has a standard score of 75 and a 90% confidence interval of 68-82, then we figure that the child's score will fall within this interval 90% of the time.
I could go on and on about different case scenarios, but basically, the best way to understand how your child is doing is to speak with the speech-language pathologist working with your child. That's why we're here!
No comments:
Post a Comment